Detailed data from the 2021 census can be downloaded <here>. There is a lot of detail across:
- Demography and migration
- UK armed forces veterans
- Ethnicity, Identity, Language and Religion
- Work and Travel
- Housing
- Sexual Orientation and Gender Identity
- Education
- Health
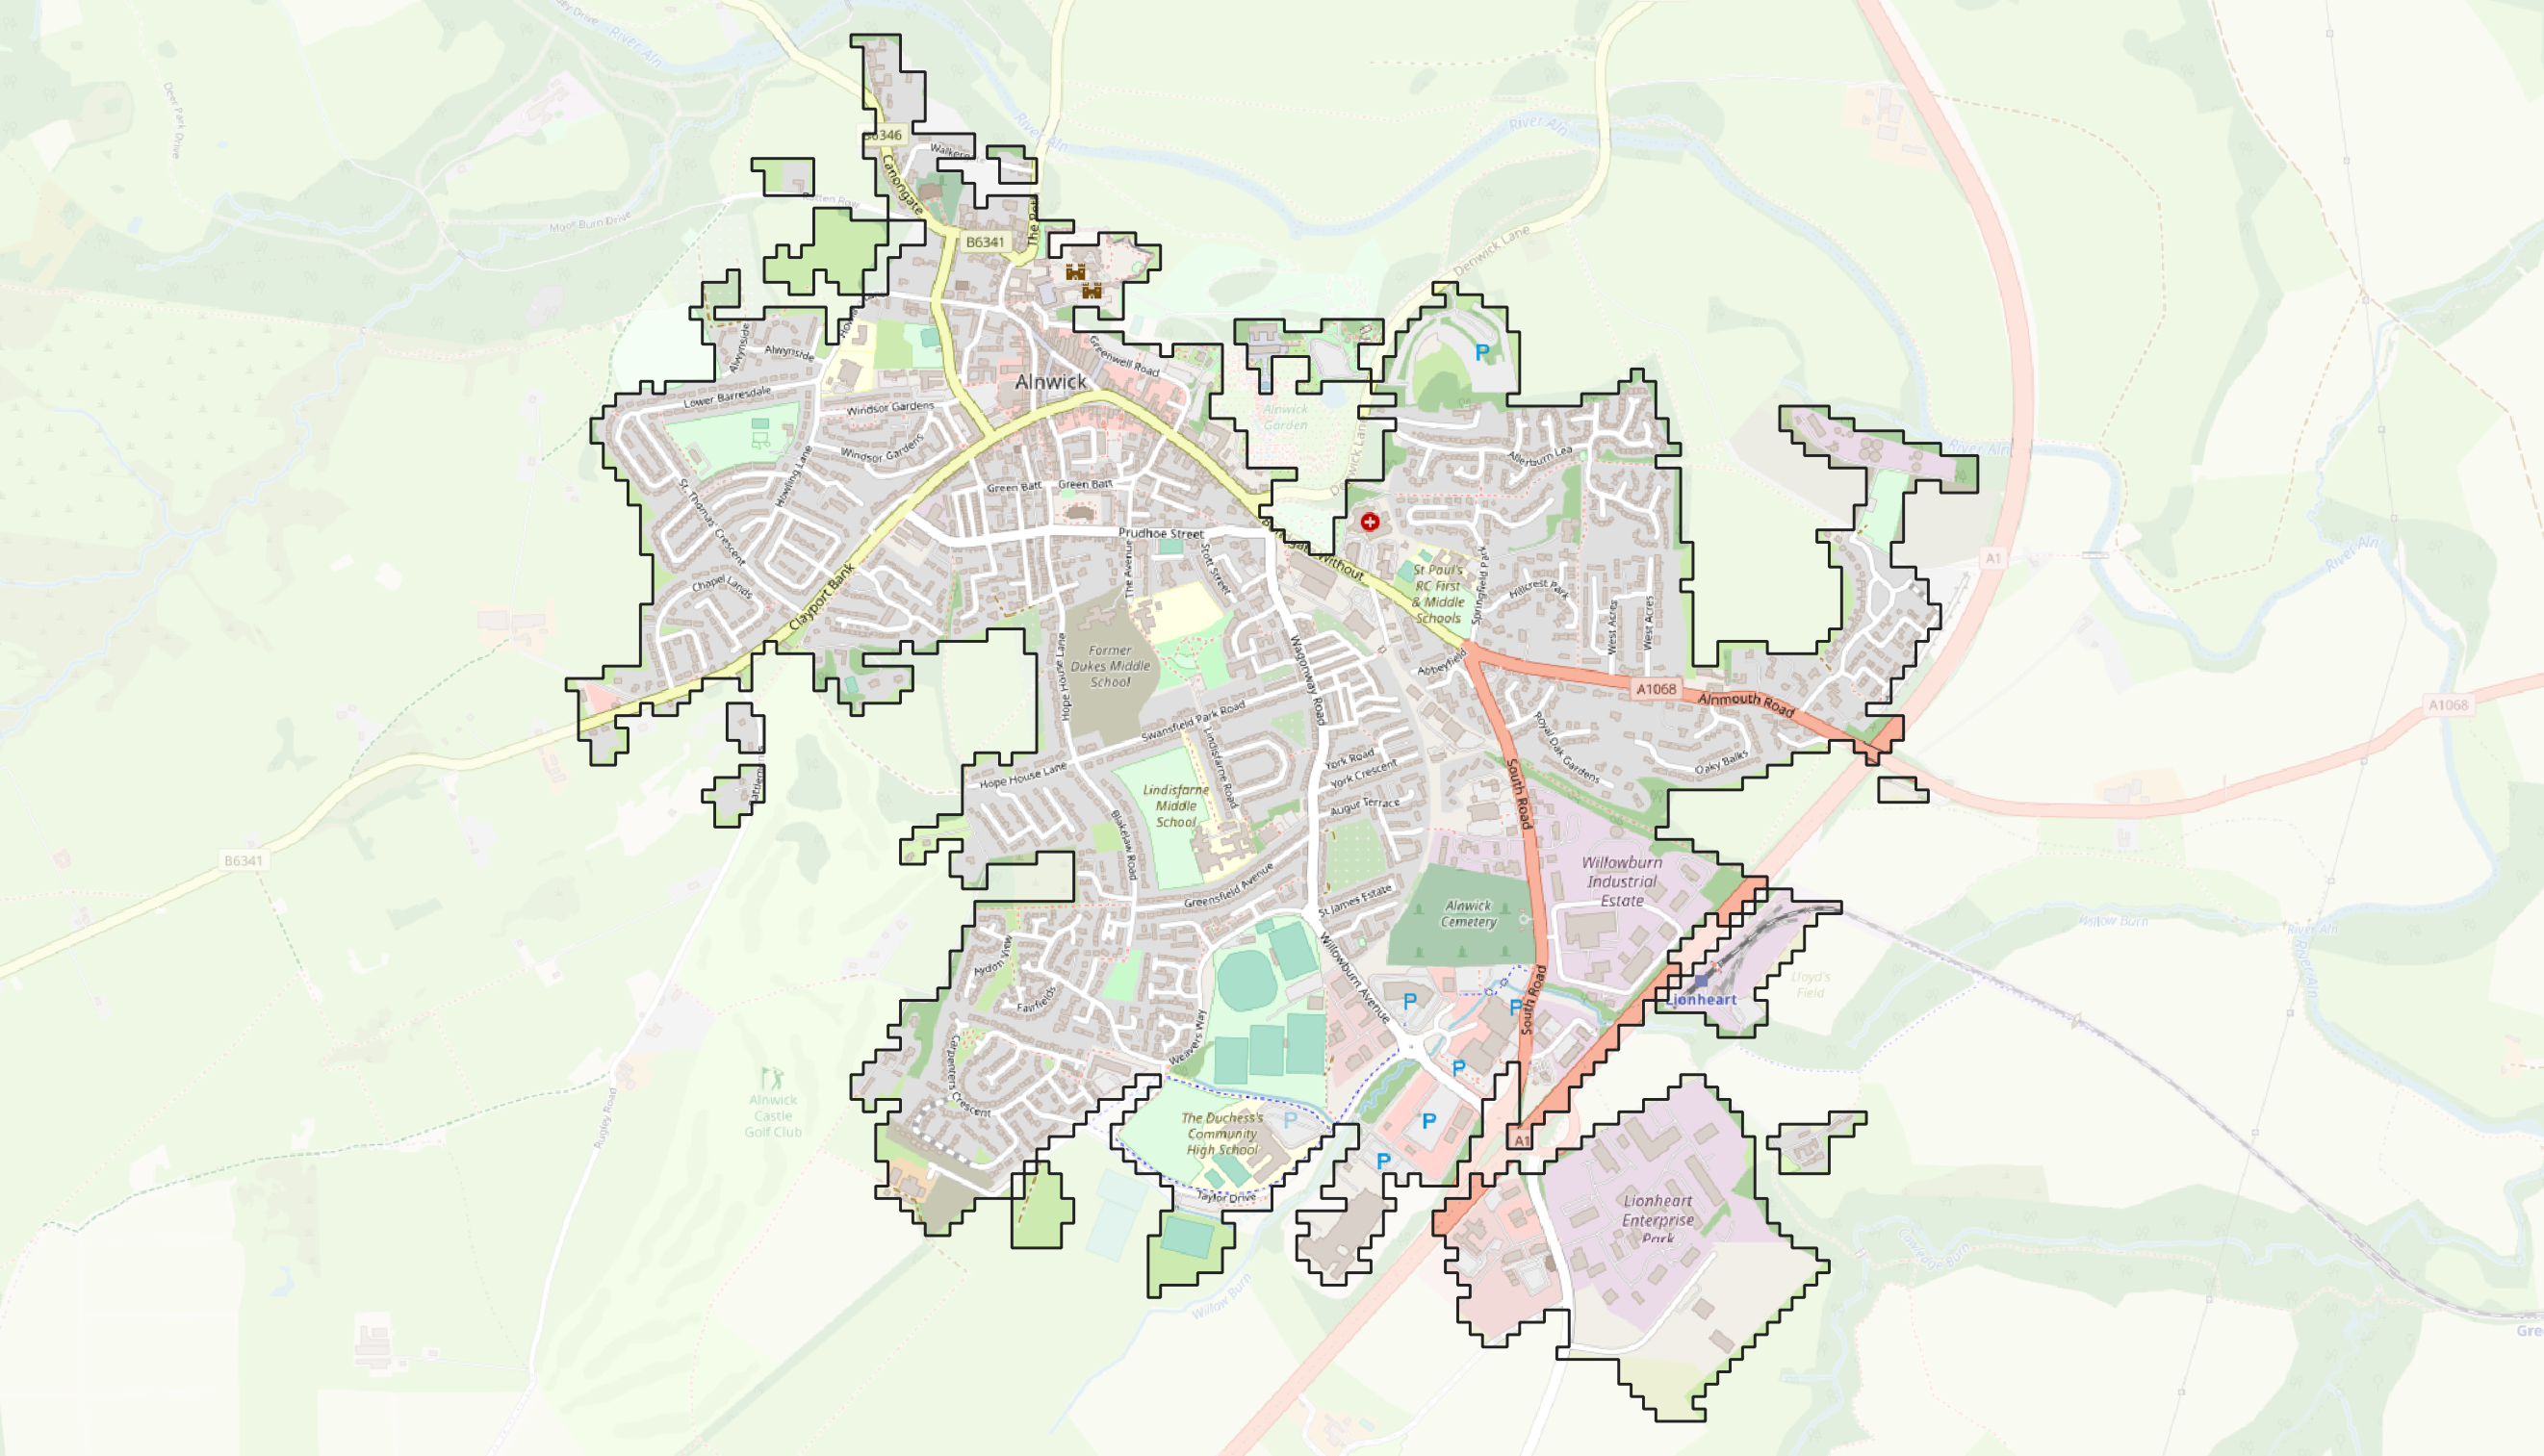
This is how the Office of National Statistics view our built-up area:
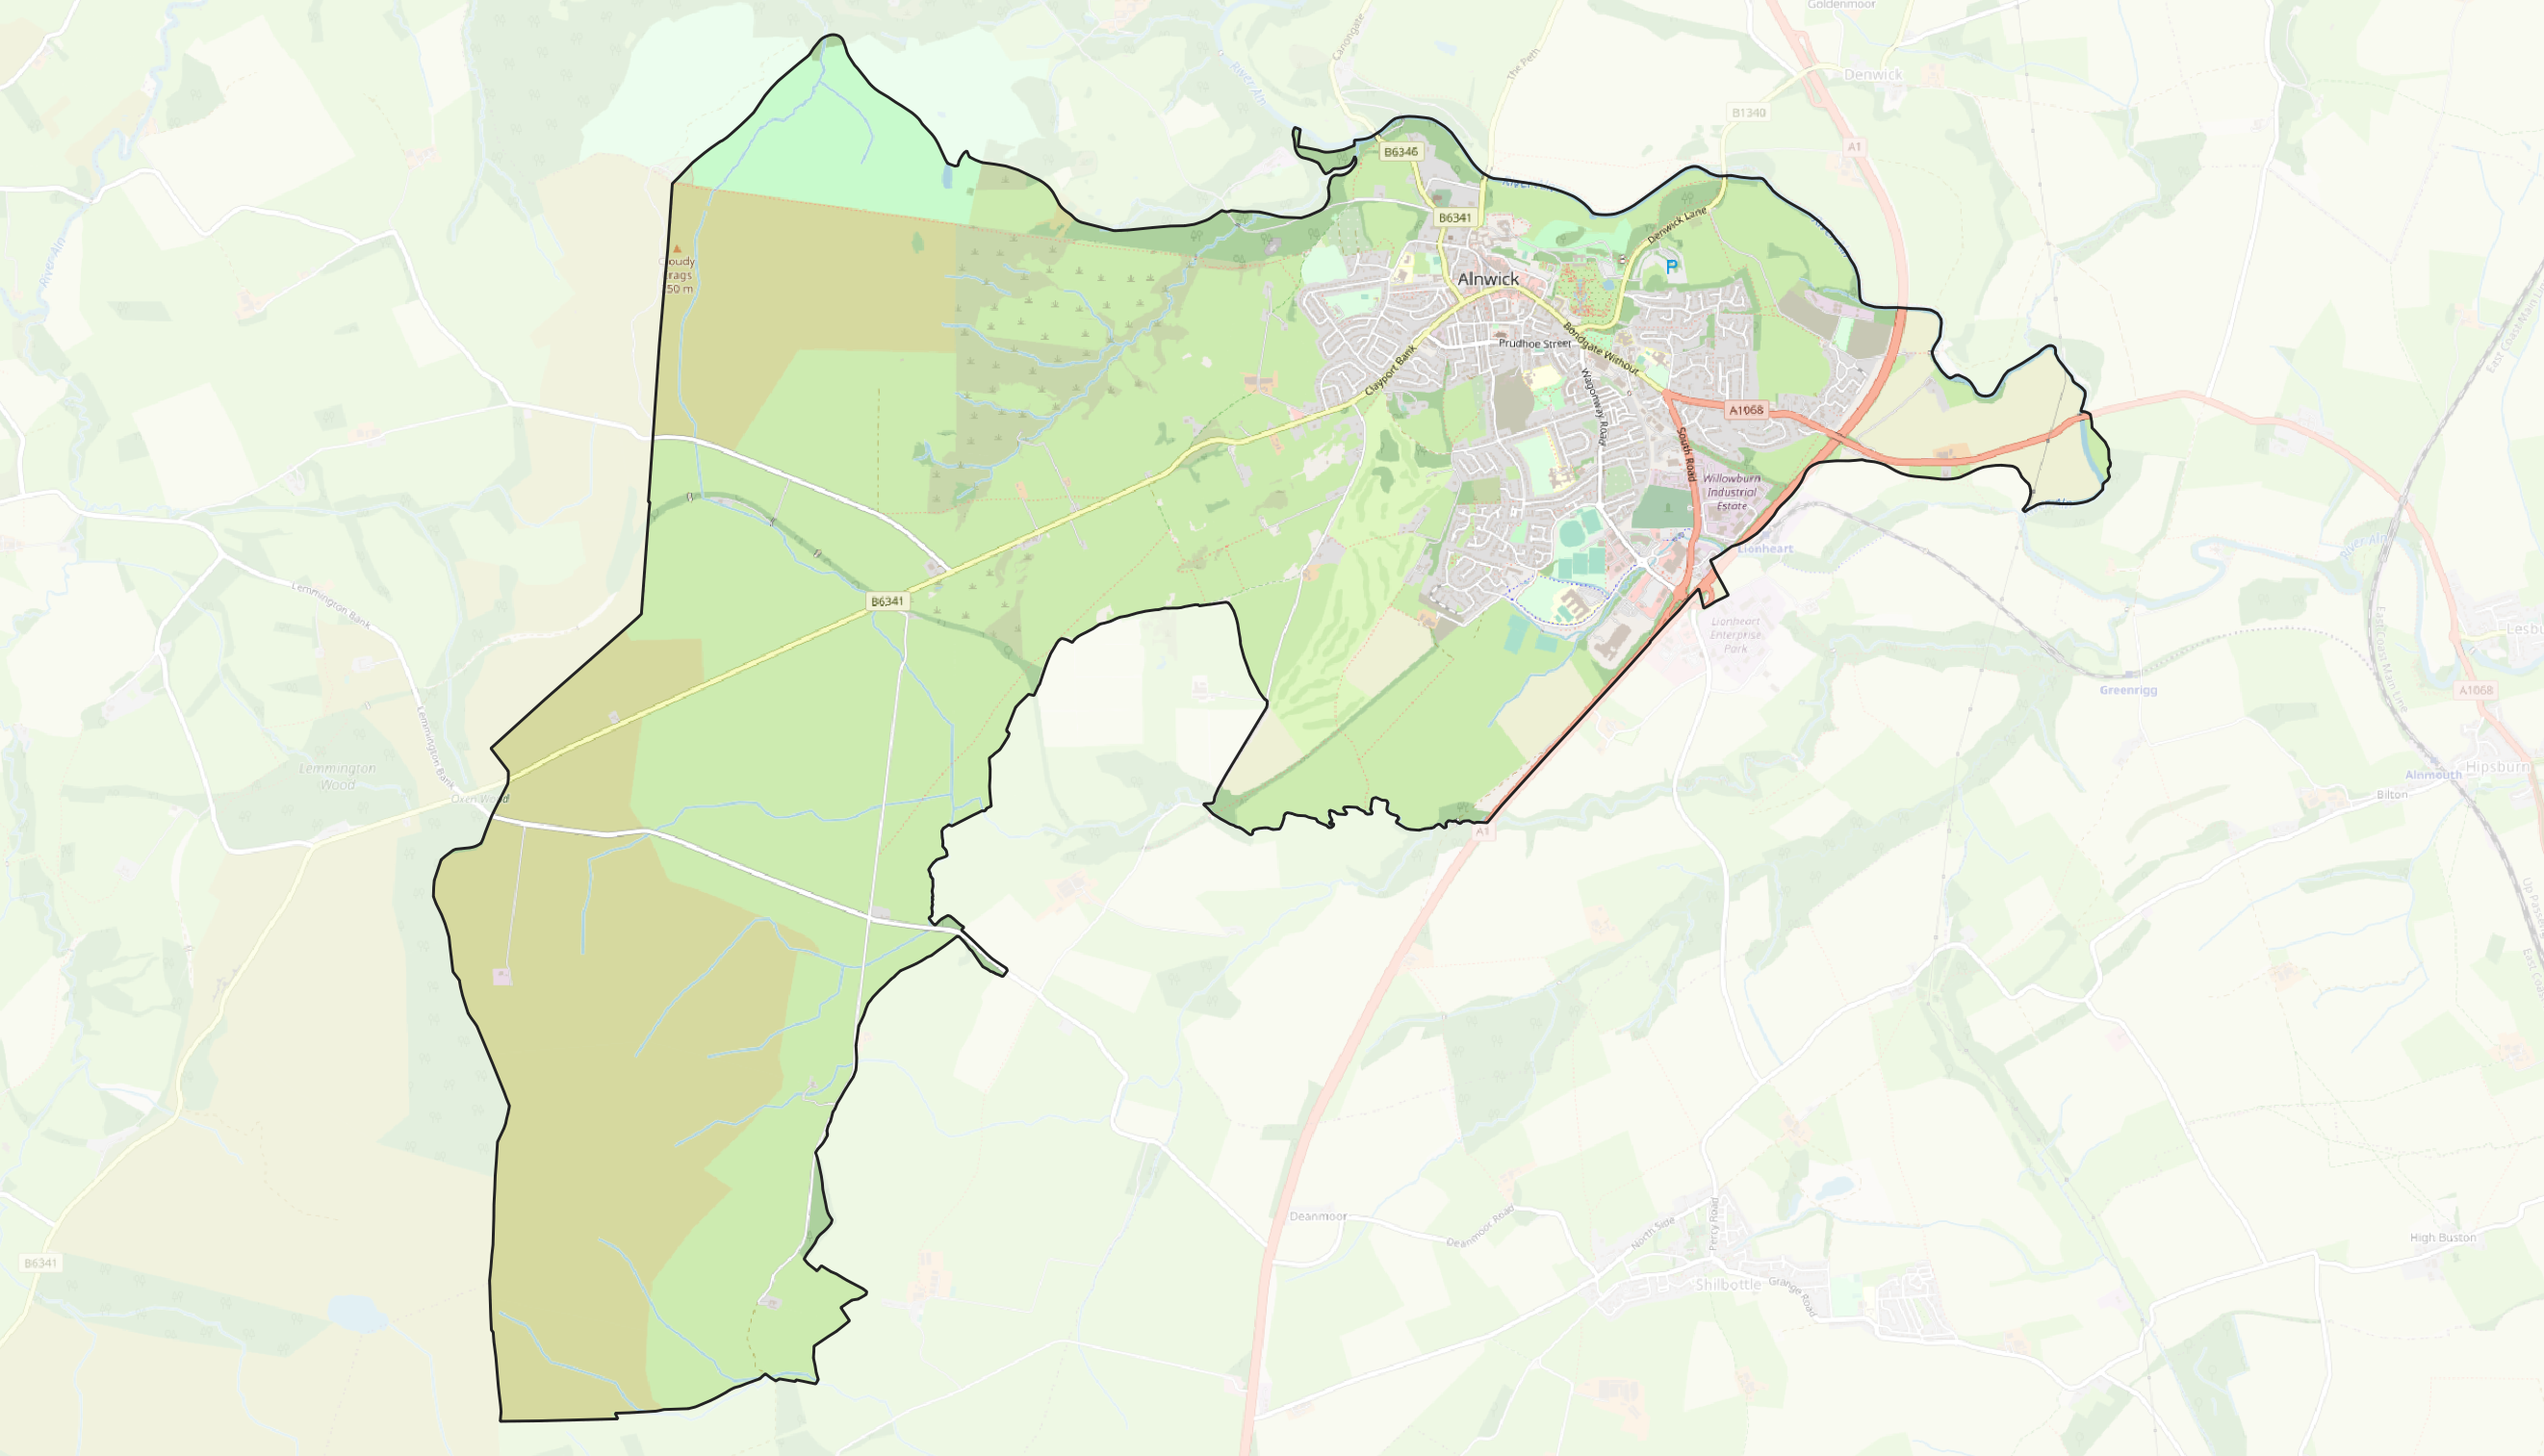
But the town that we think of as “Alnwick” doesn’t fit comfortably into all the different ways that census data is used. This, for example is the boundary of the Alnwick Parish:
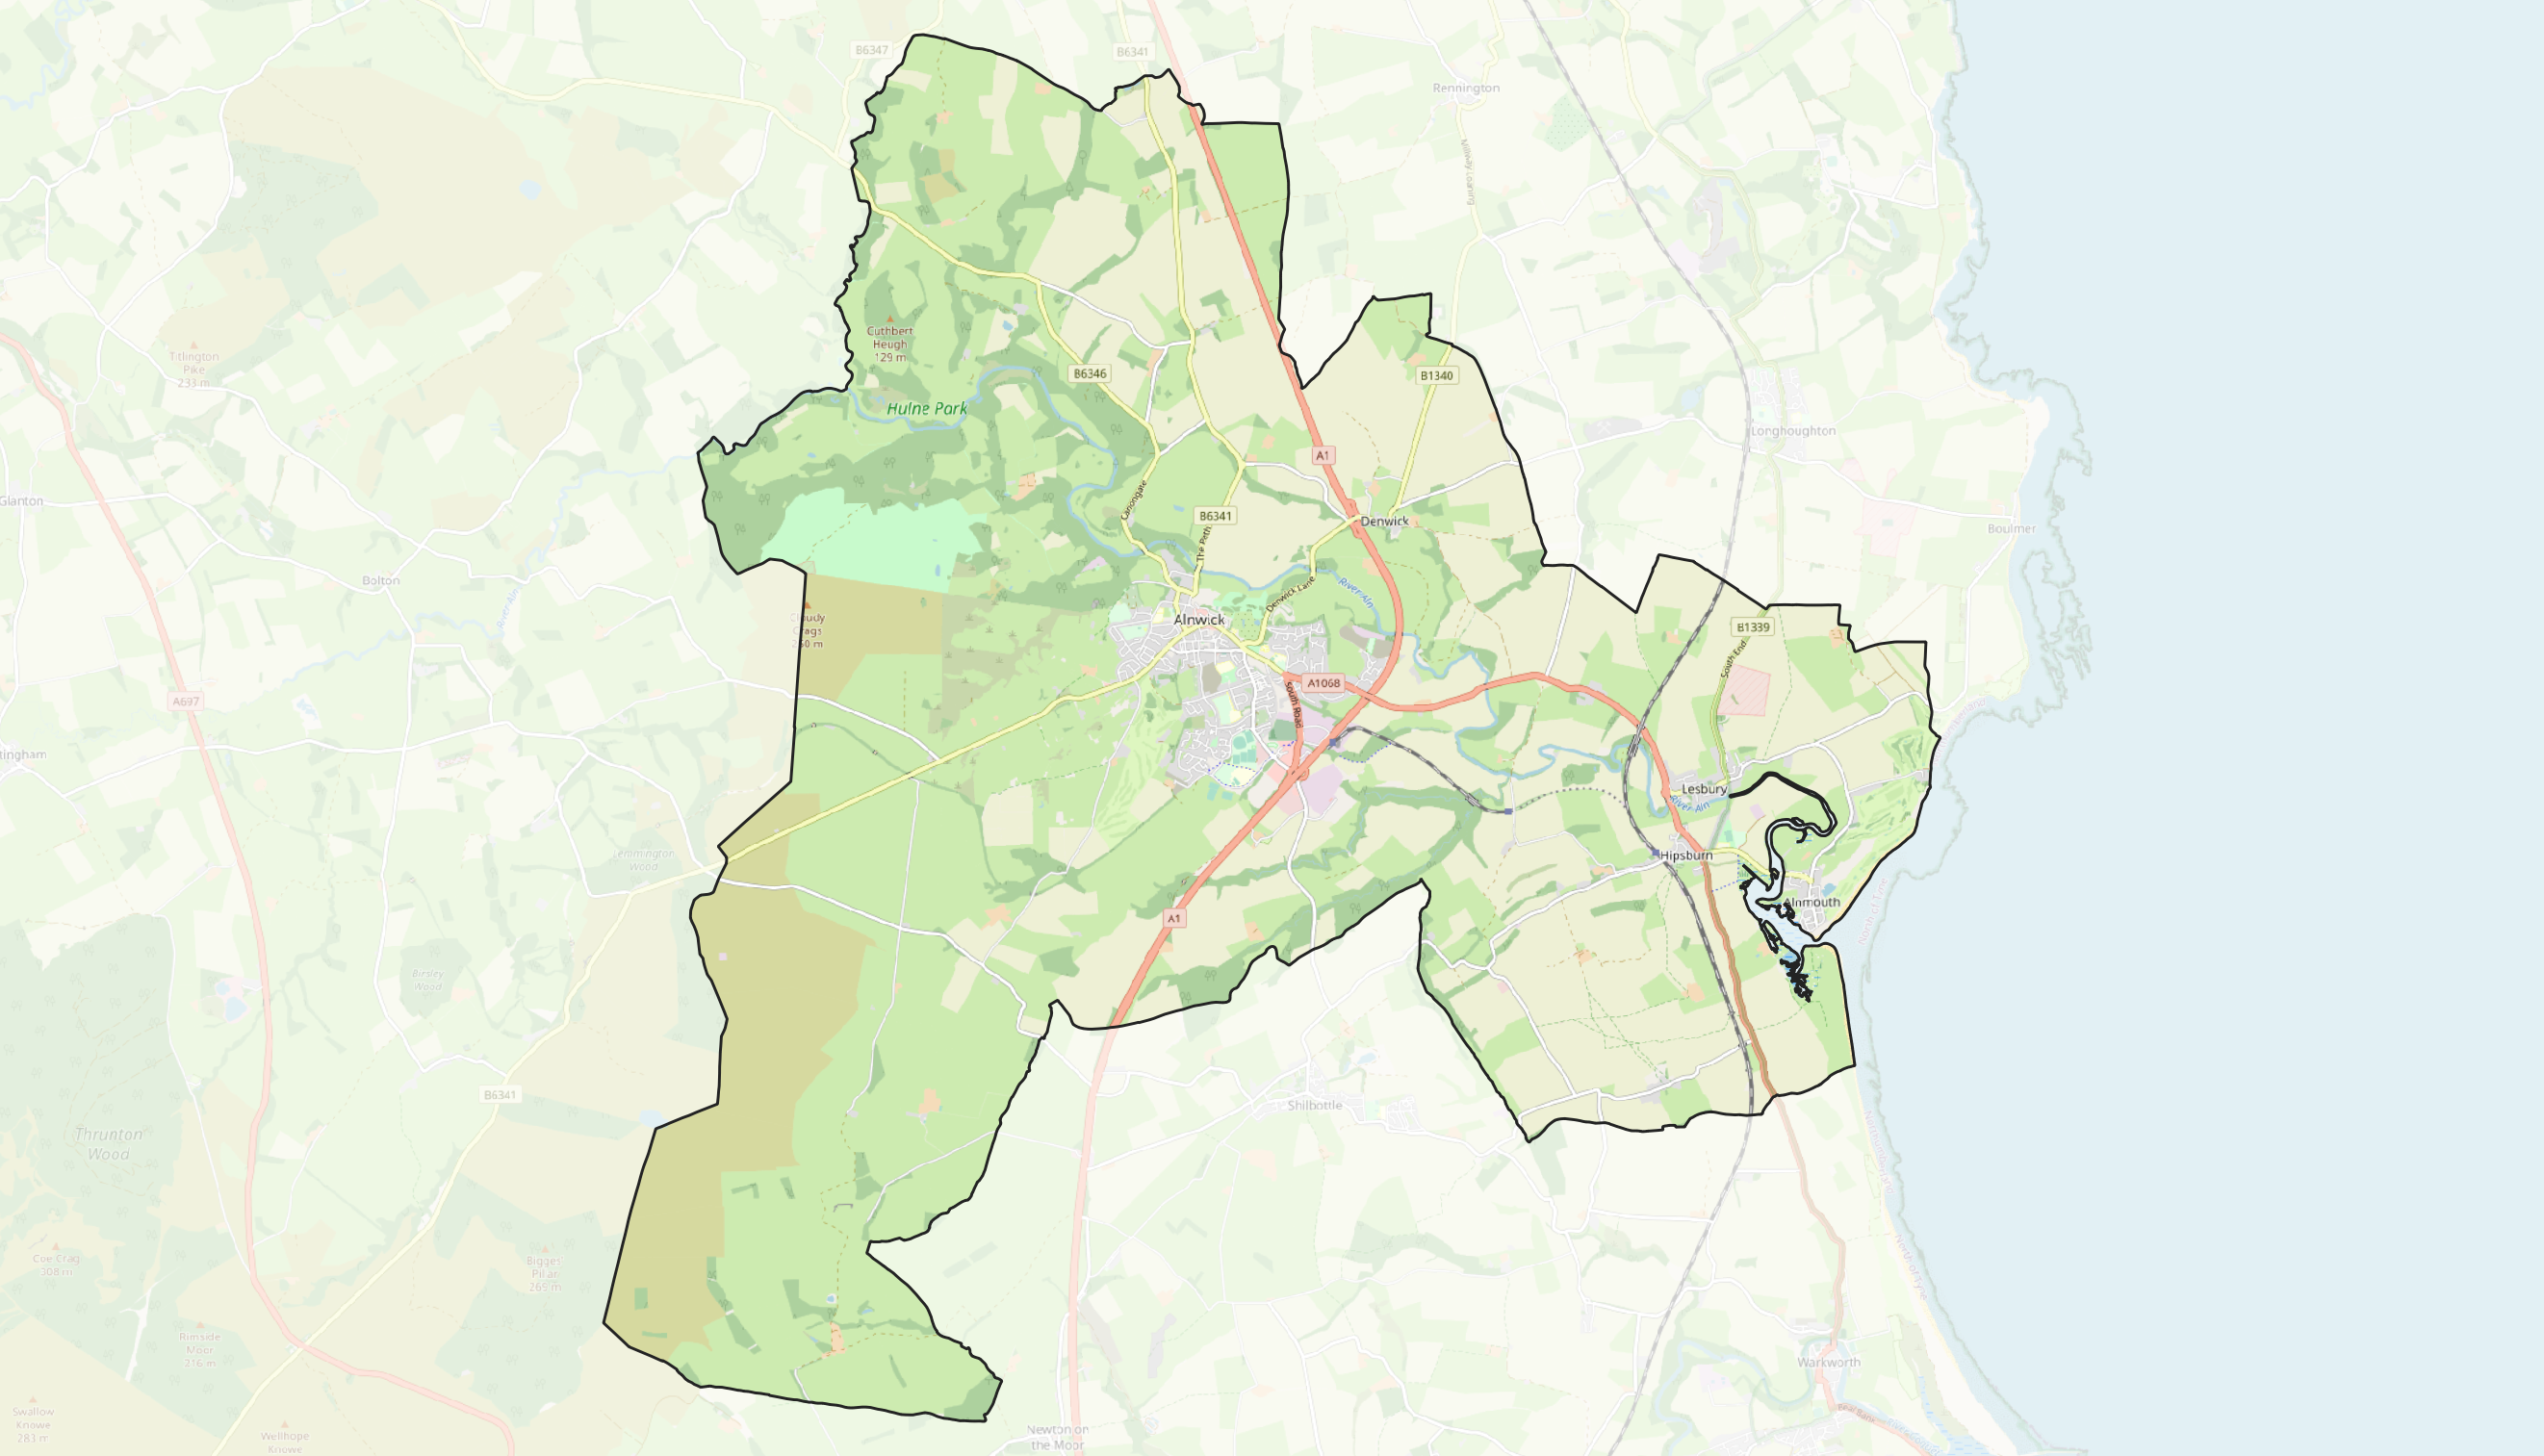
And this is the boundary of the Alnwick Ward. The town of Alnwick accounts for about 86% of households in the ward.
So it’s useful to understand how different census views compare.
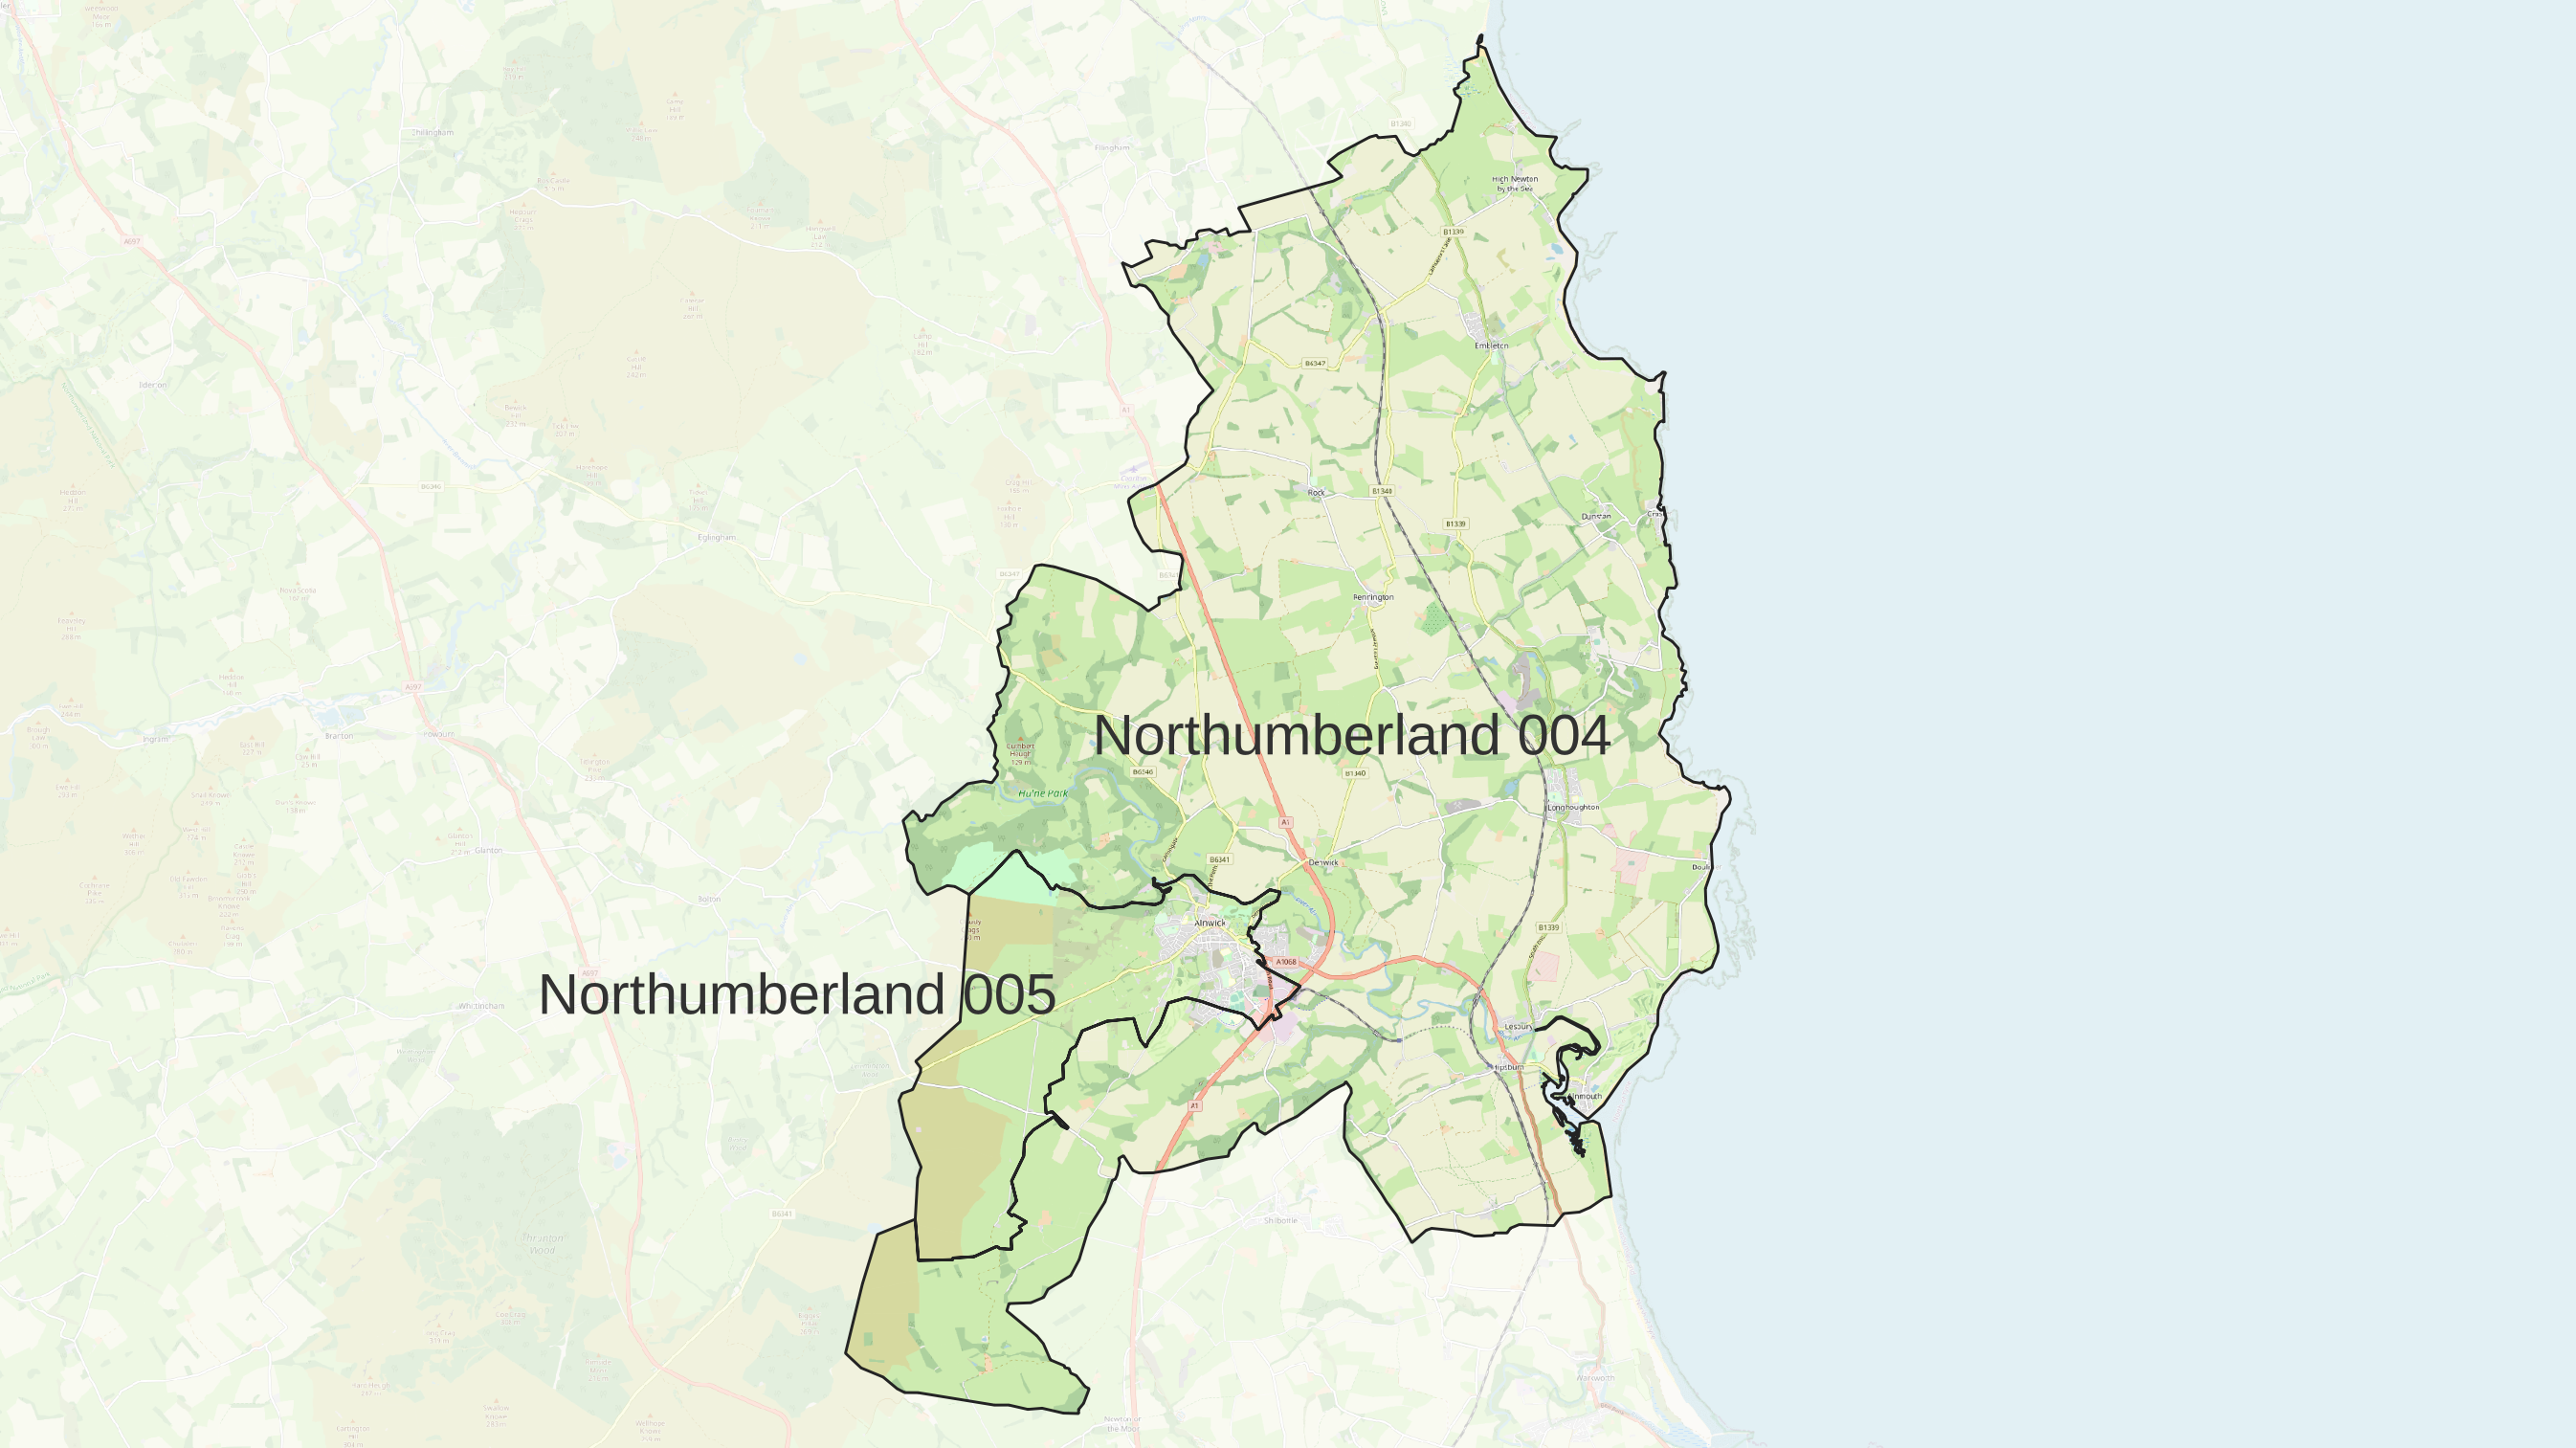
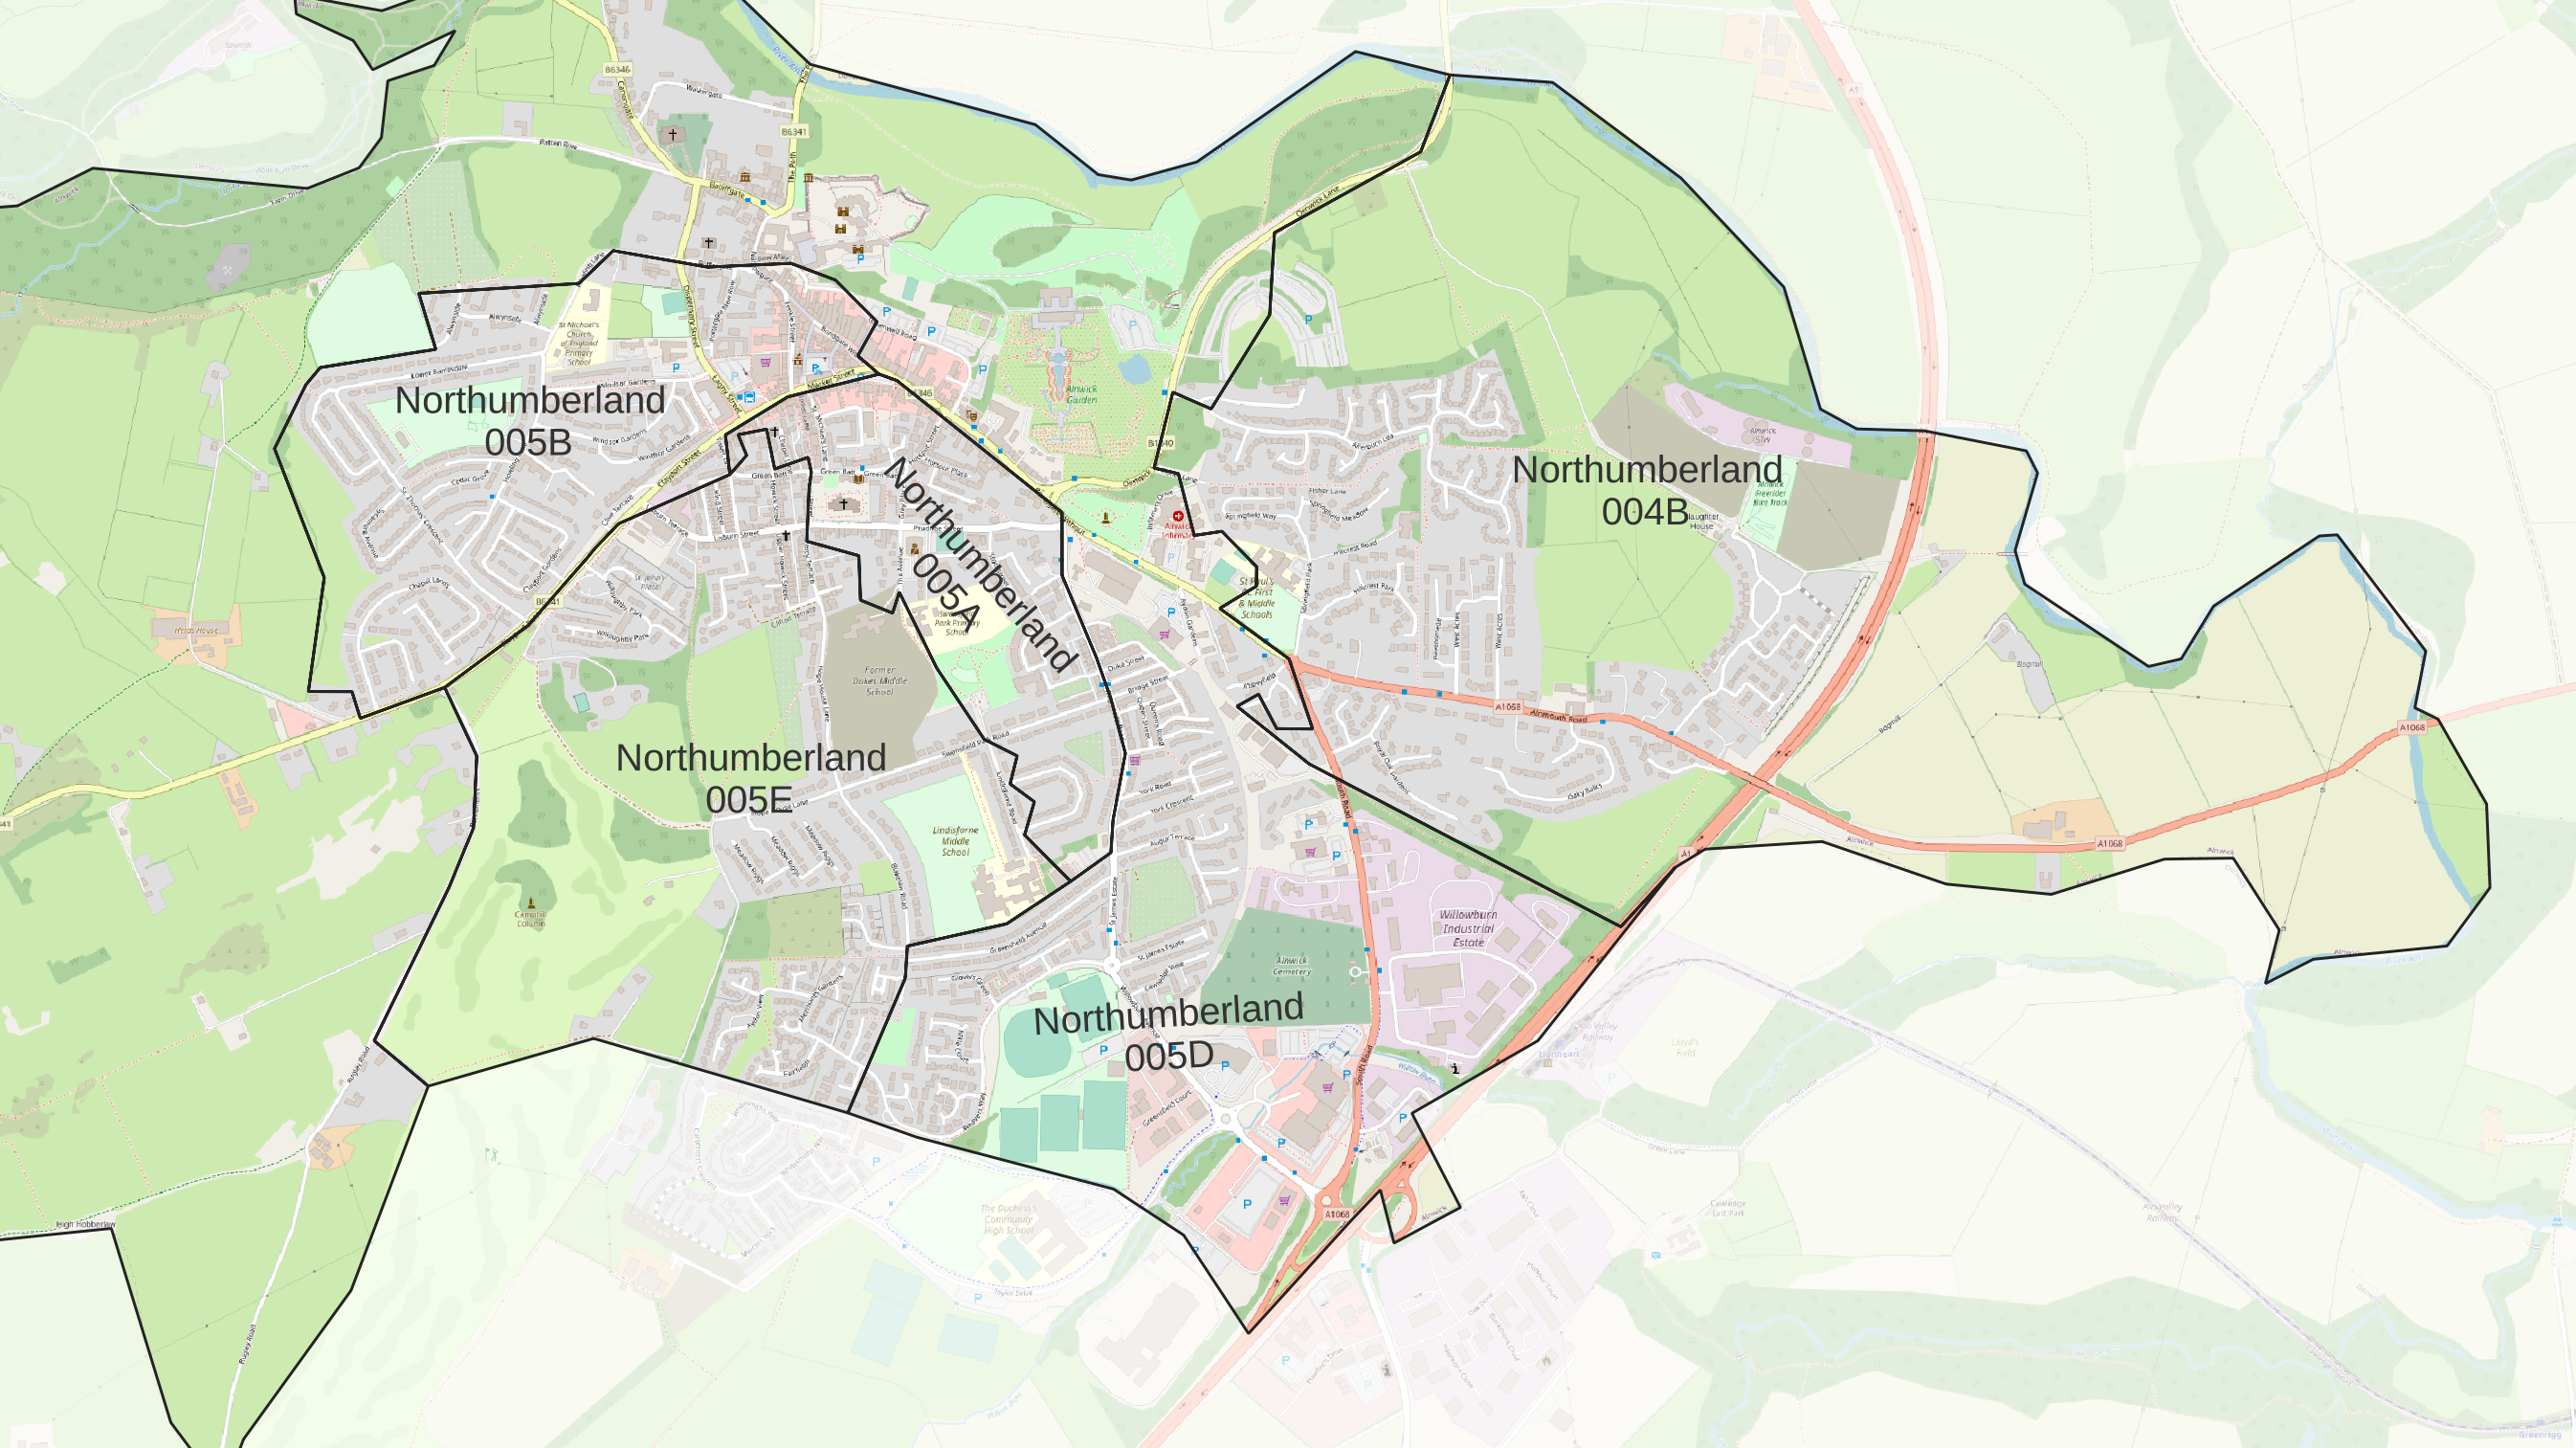
The most detailed views of census data are Output Areas. At the bottom is a map of 28 output areas that cover Alnwick. However, for most purposes these are too detailed, and they are grouped into Middle Super Output Areas, or Lower Super Output Areas.
The map at the top shows Middle Super Output Areas, and the map below shows Lower Super Output Areas. The MSOA called “Northumberland 005” covers most of the town, but it doesn’t cover Allerburn Lea, Springfield Park, or new developments on Peter’s Mill, or Greensfield. We estimate that about 14% of Alnwick households fall outside Northumberland 005.
To get more complete coverage of Alnwick itself we need the following Lower Super Output Areas:
- Northumberland 004B
- Northumberland 005A
- Northumberland 005B
- Northumberland 005D
- Northumberland 005E
With this list, we get data on most of the town and Alnwick Moor. We are still missing parts of the new Greensfield development, Peter’s Mill and pretty much everything to the east of the A1, but at the time of the 2021 census this captured almost every household in the town. If we had wanted to include areas of new building we would have to add in the Northumberland 004A area. Howver, this also includes Alnmouth, Hipsburn and Lesbury. It would add about 1,000 households, so it’s liable to distort the picture.
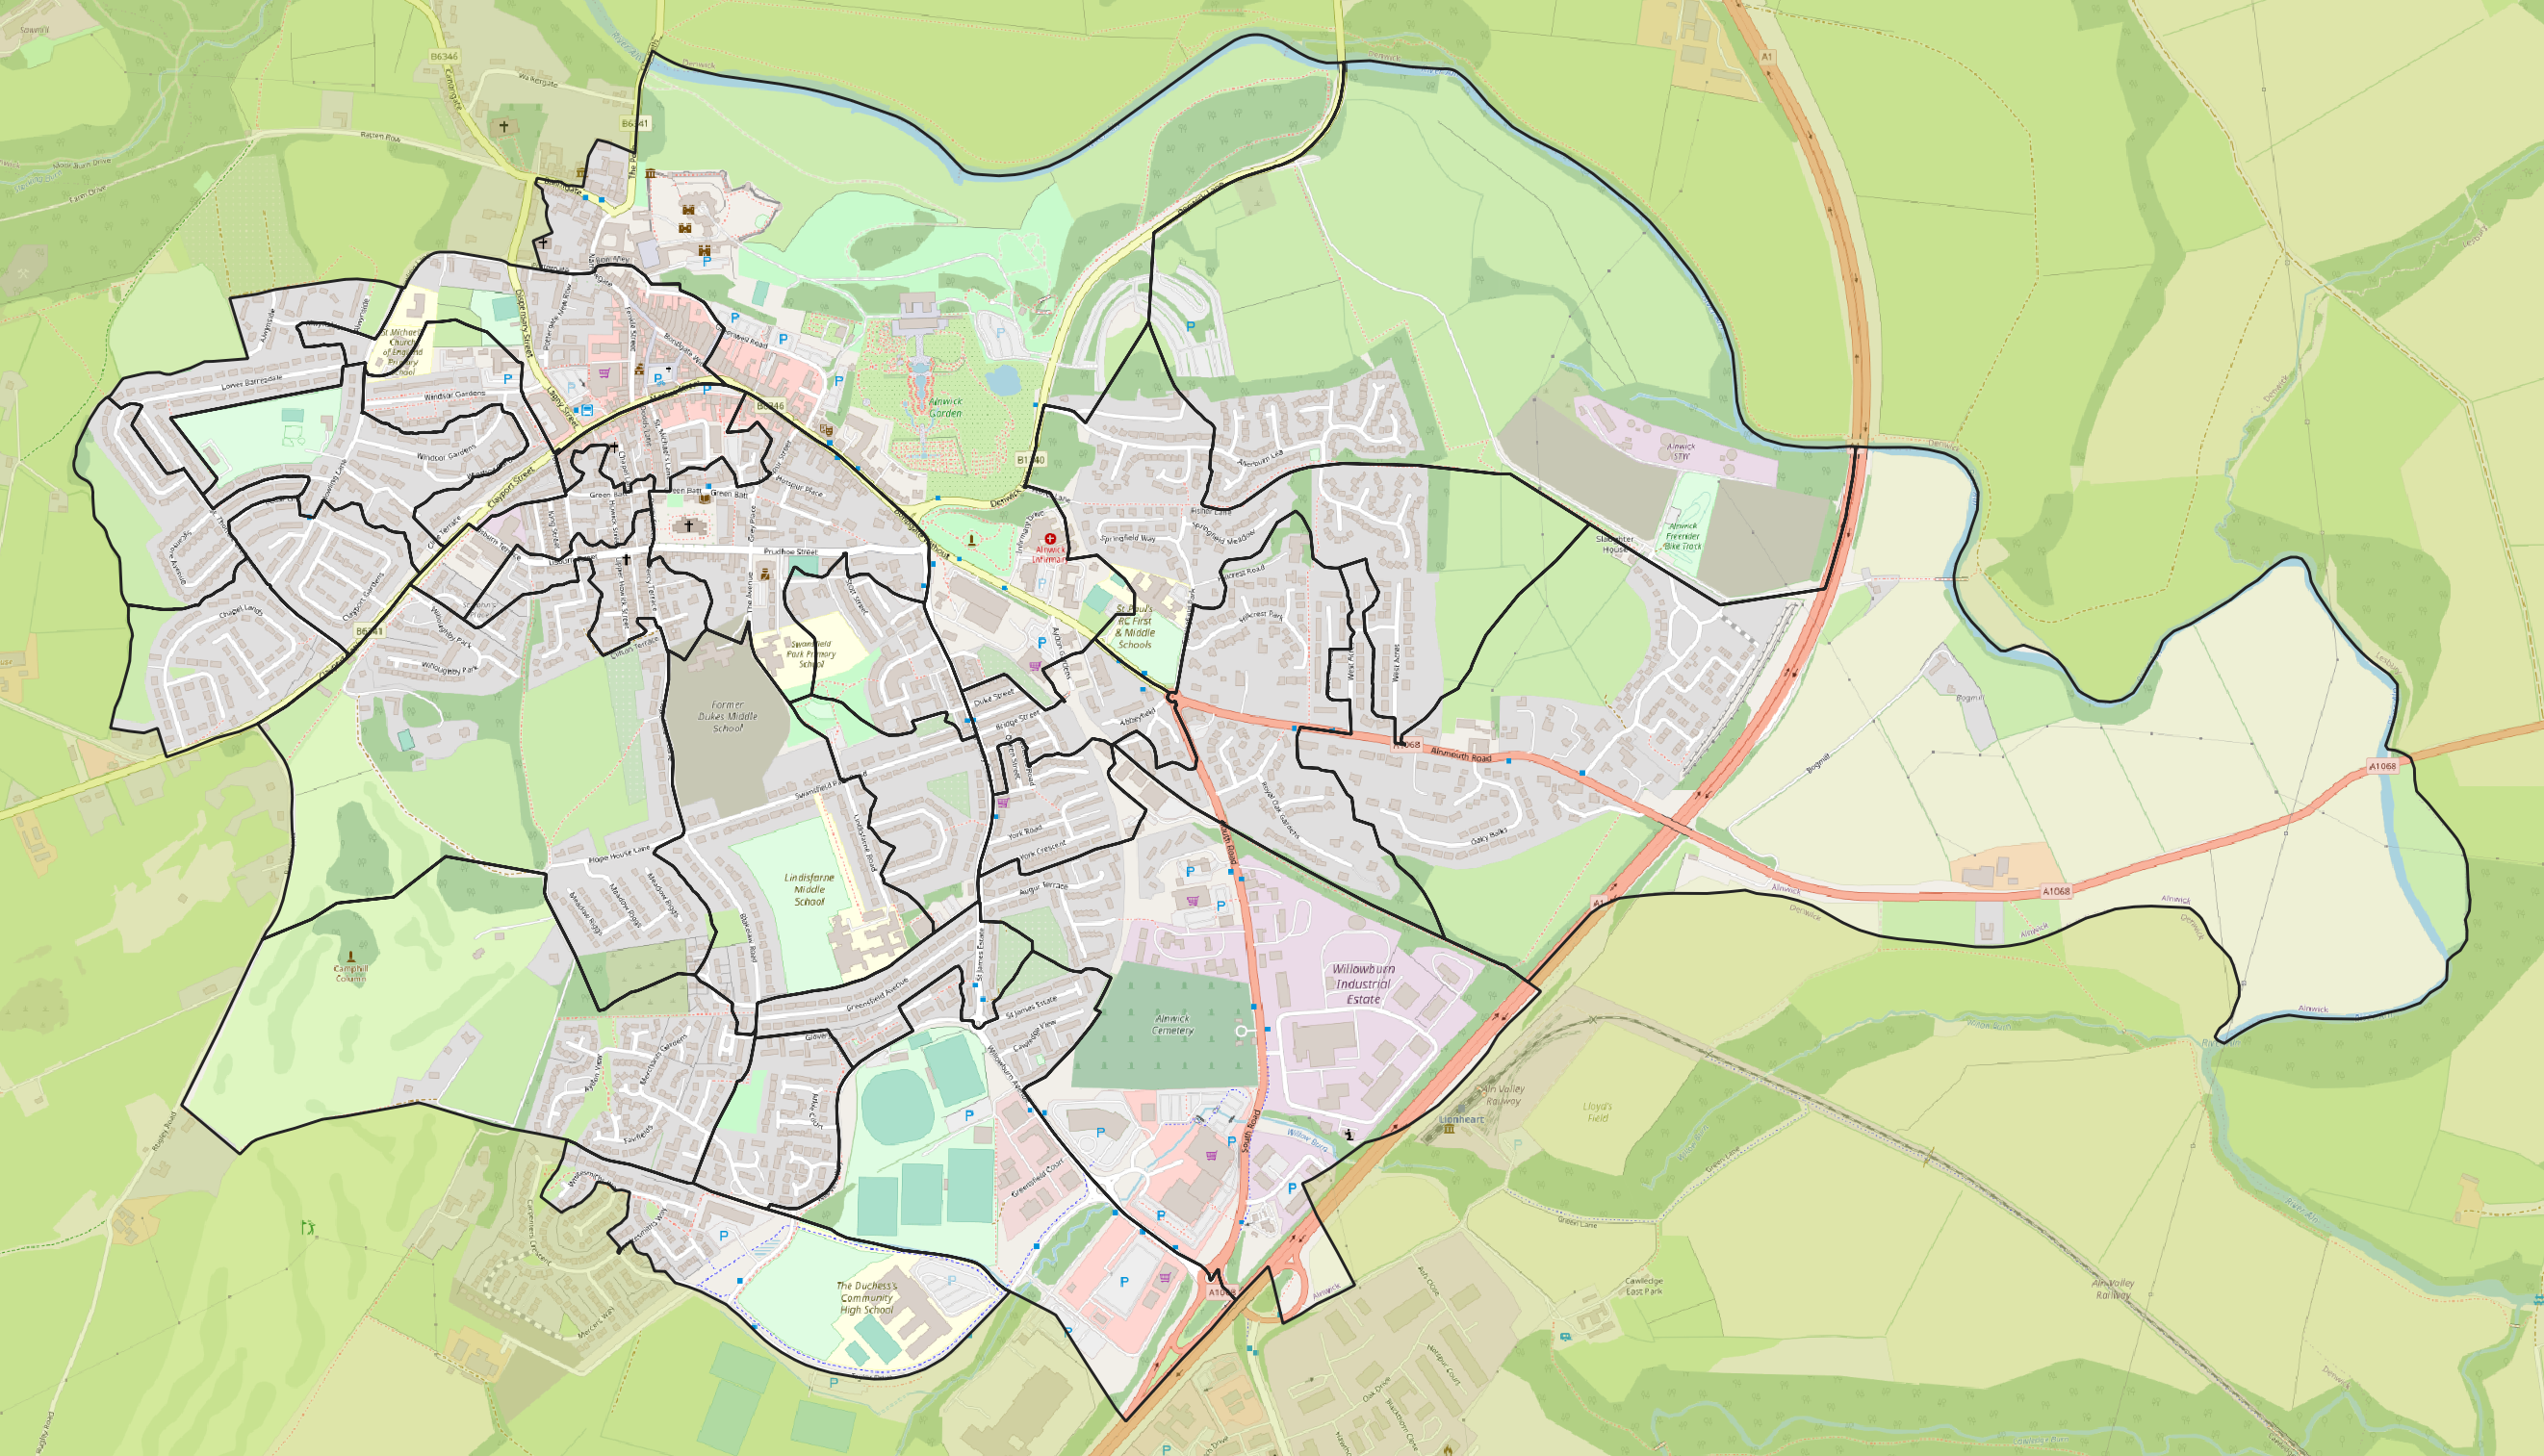
There are some more detailed figures at the level of a smaller Output Area. Where these are available, the ones to pick for Alnwick are: E00190105, E00139182, E00139181, E00139183, E00139184, E00139185, E00139186, E00139187, E00139188, E00139189, E00139191, E00139192, E00139193, E00139194, E00139195, E00139196, E00139197, E00139198, E00139199, E00139200, E00139201, E00139202, E00139203, E00139204, E00139205, E00139206, E00139207, E00139208.
Using these will produce a breakdown that looks this.

There is detailed migration data <here>:
And origin / destination data <here>