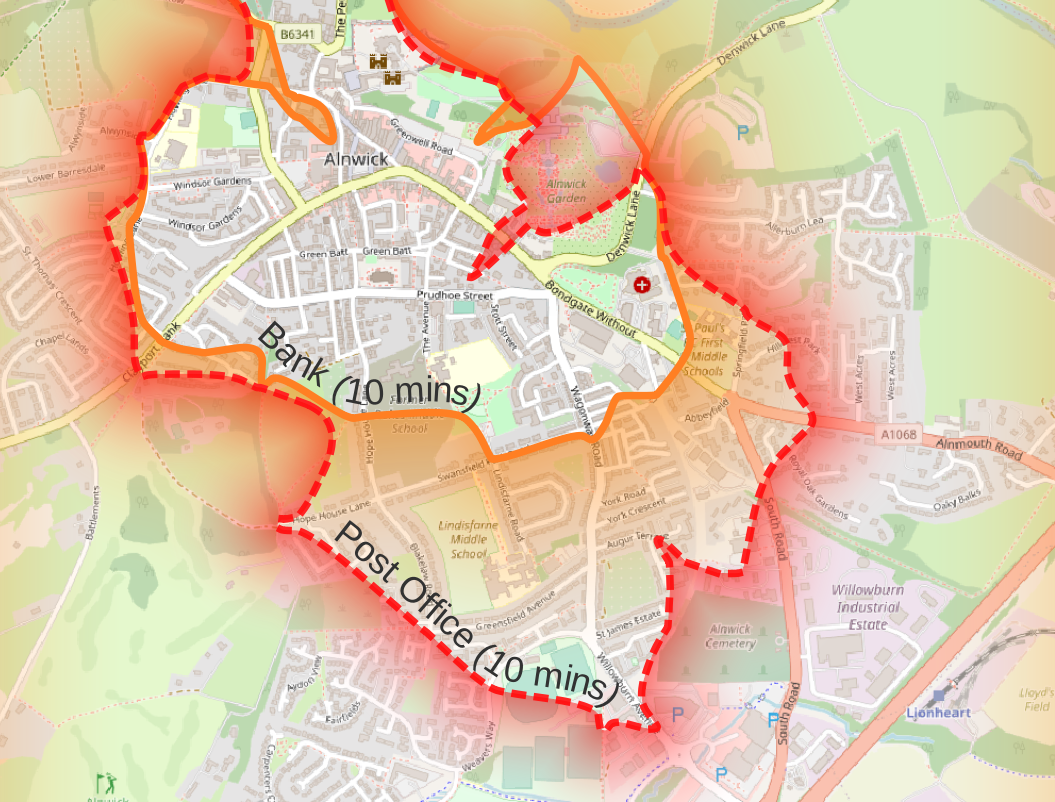
“20 minute neighbourhoods” are places where people can meet their daily needs within a walk or cycle ride of 20 minutes or less. Ten minutes there; ten minutes back. We wondered how many households in Alnwick are reaping the benefits that 20 minute neighbourhoods promise, and we started drawing maps like this. People asked how we did it.
We used QGIS for the maps, and OpenStreetMap data for the road network. As well as drawing the maps, we went on to estimate the proportion of households in Alnwick that fell within a ten minute walk of different amenities. That got more complex, and needed different tools. The maps, though, were relatively straightforward. These are the steps we took. If you know of better ways to do this, or if you have suggestions of how to take it further then we would welcome advice.
First you will need a copy of QGIS, and a couple of extensions.
- Download QGIS from here – https://qgis.org. and install it.
- Add the QNEAT3 and QuickOSM plugins by going to the menu item “Plugins -> Manage and install plugins”. Search for the name, click on “Install”, and make sure that the checkbox next to the name is ticked to enable the plugin.
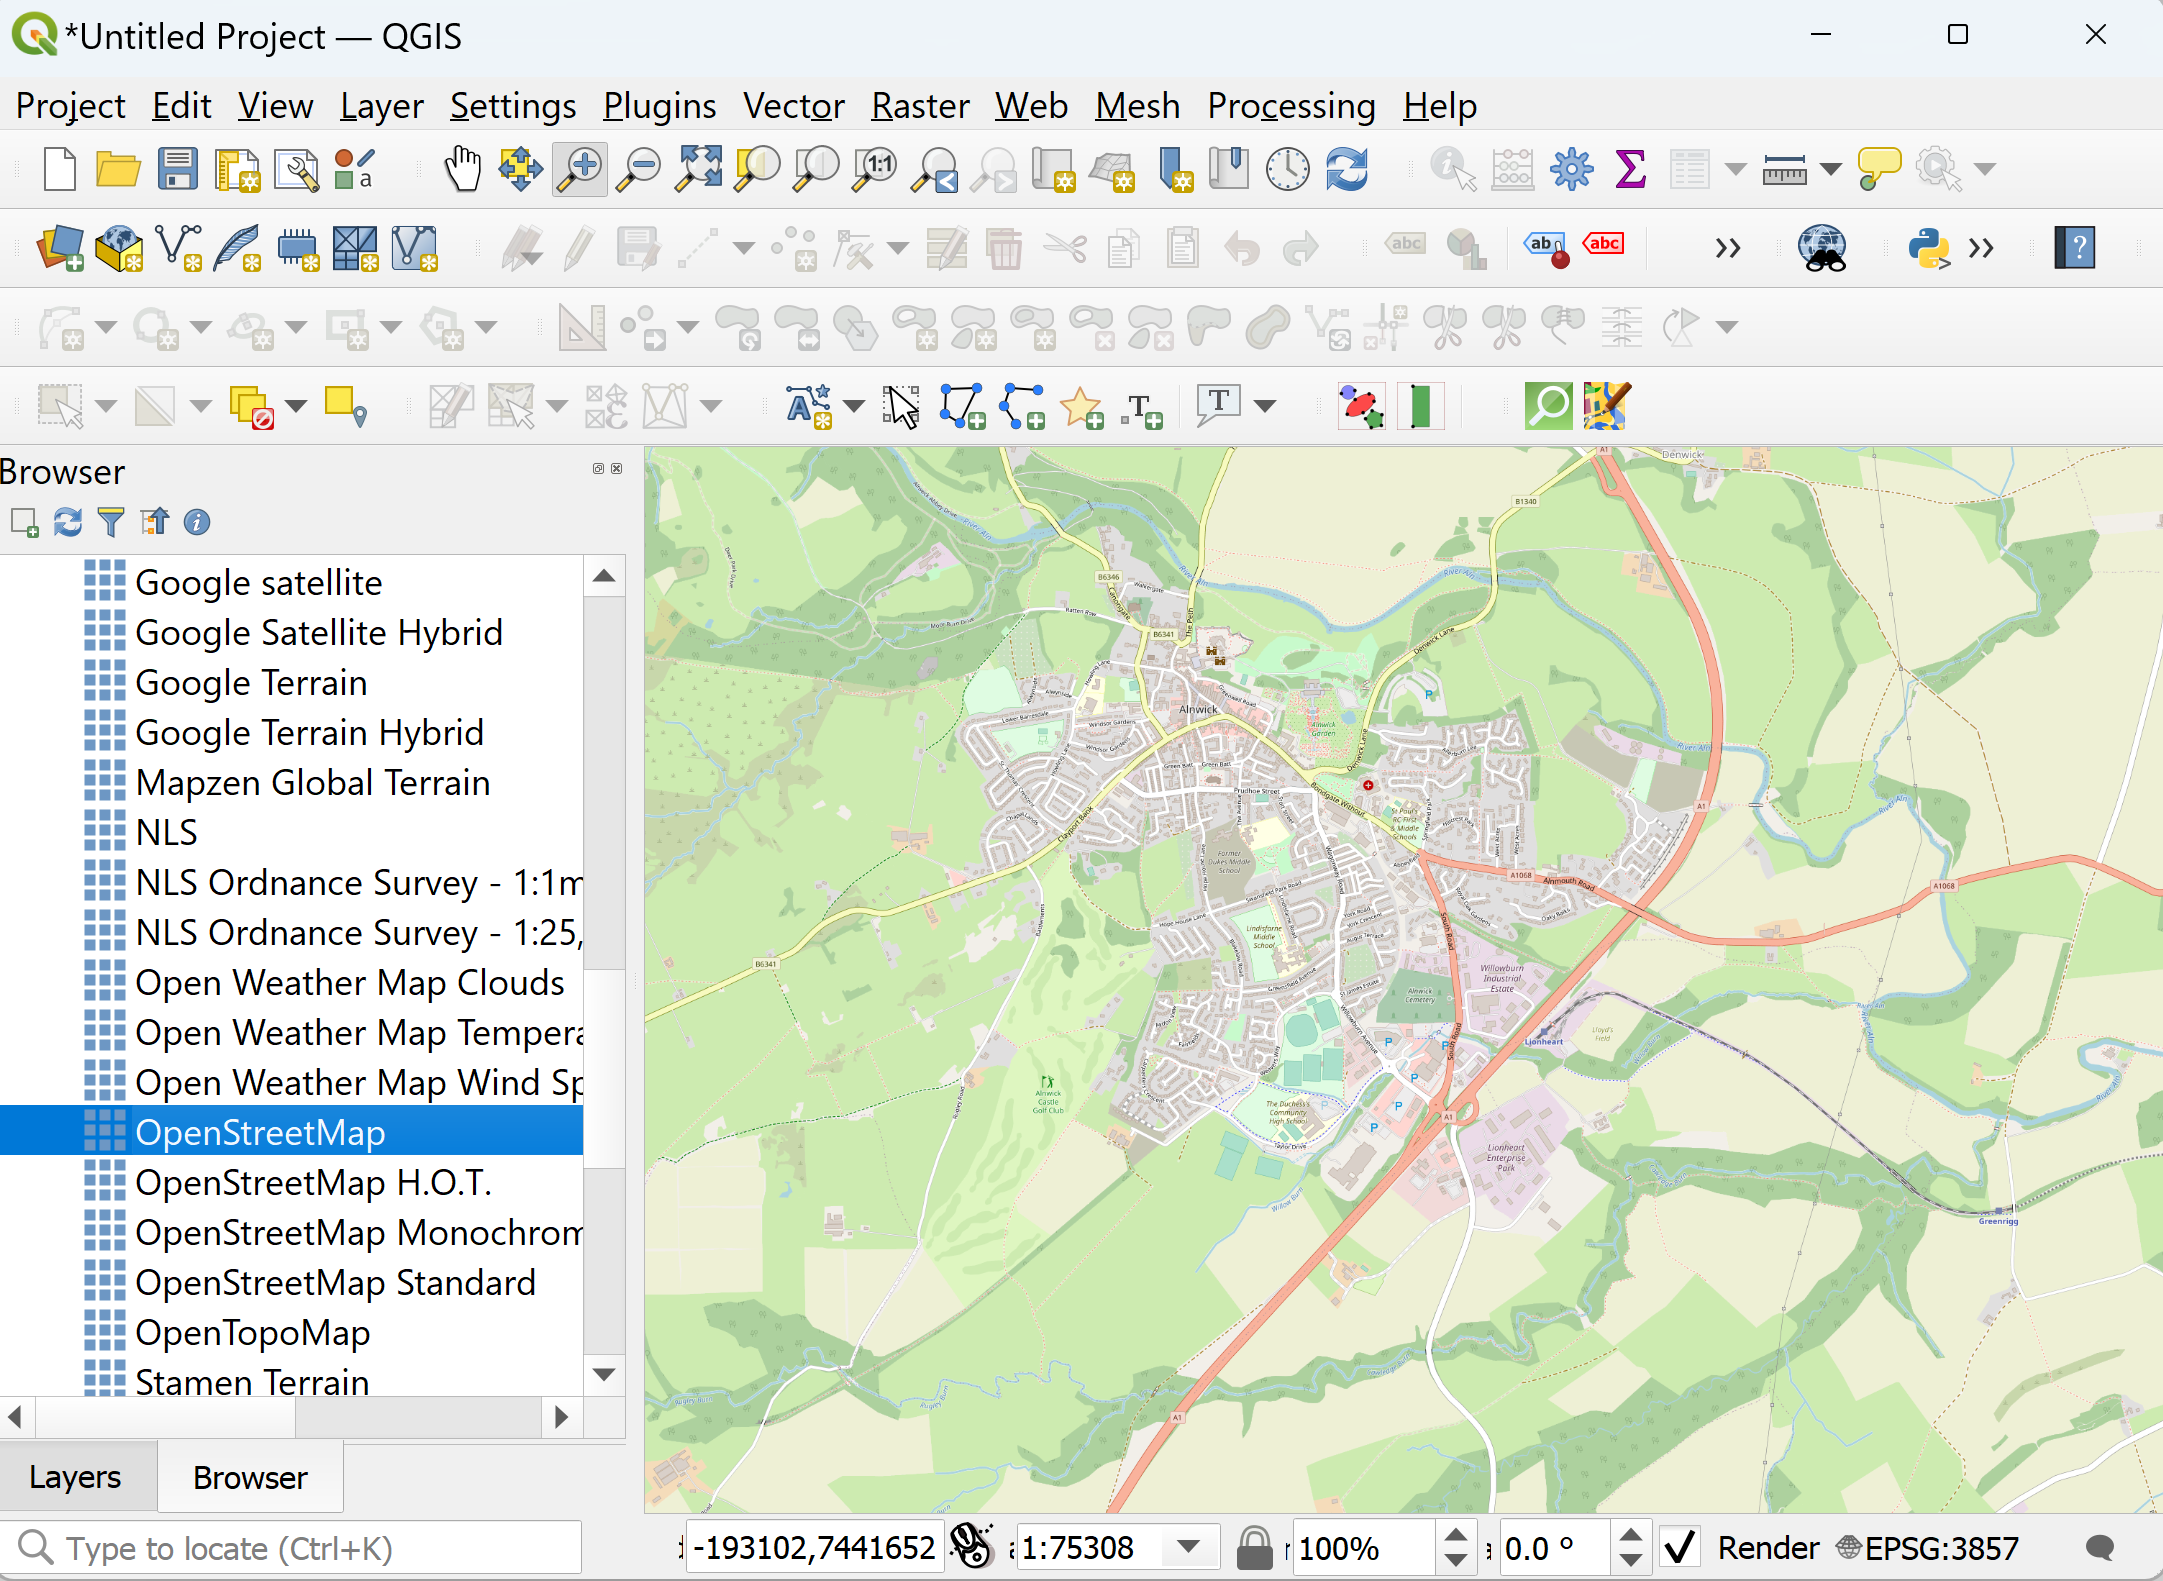
It’s going to be handy if you first zoom in to the area that you want to examine. Find the “Layers” Browser in the panel on the left of the QGIS screen, scroll down for “XYZ tiles” and pick a background map. We used OpenStreetmap. Use that to zoom in to the area that you are interested in.
Next you need some data on the highway network. We found two useful sources for this.
- Ordnance Survey publish Open Roads. This is a high-level view of the road network. We wanted walking distances, but footpaths aren’t included. So we didn’t start here, but the data is easy to download and use. If you are more interested in cycling then it may be good enough for you. In any case it’s the easiest way to get started, so if you are happy to work with roads:
- Download the ZIP file, and extract the files.
- Go to the QGIS top menu “Layer -> Add layer -> Add vector layer” and pick the shapefile that covers your area. The name is based on the first two characters of the OS grid reference, so for Kent, for example, it will look something like “TR_Roadlink.shp”.
- The data we used came from Openstreetmap. This has comprehensive details of the road network. Getting hold of it is a slightly more complex process than the Ordnance Survey data, so you may want to begin experimenting with the Ordnance Survey data before you try this.
- The easiest way to download an extract of OSM data is from the QGIS QuickOSM plugin. Once you have installed this, Zoom in to the relevant area of the background map.
- Start the QuickOSM plugin from the top menu: “Vector -> QuickOSM”.
- Select all values of the key “Highway” and “Canvas Extent”.
- Run the query and all the roads and footpaths should appear as three layers (points lines and areas) all called “highways”
- To keep things simple we will just use the lines, so go back to the “Layers” panel on the left of the QGIS screen, and turn off, or remove the other two “highways” layers.
- We then need to transform the highways data to a different projection. On the top menu pick “Vector -> Data Management Tools -> Reproject layer”. As the input layer, pick the one called “highway” that includes lines (not the ones that include points or areas) and select “EPSG 2770: OSGB 36 British National Grid” as the Target CRS.
- Another layer called “Reprojected” should appear. This is your road network.
Now you are ready to start using the data. From the top menu, select “Processing” to open the toolbox, and use the search box to find QNeat3. There are several options, but we will begin with “ISO area as contours from point”. This is the easiest, so it produces the quickest result.
- In the Processing Menu, under QNEAT3, click on ISO area as contours from point”, to open the list of options.
- Choose your network layer (if you used Ordnance Survey data it will look something like “XX_Roadlink”, if you used OpenStretmap it will probably be called “Reprojected”.
- To pick a start point from the map, click on the ellipsis (…) then use the map to choose the location. For now everything else can default. Measurements are in metres, and it assumes walking speed of 5kmph.
- Hit “Run”, and let it chunter away for a bit.
What you will get back is a grey-scale interpolation layer, and a set of contours showing distances from the start point. At this point we suggest turning off all the intermediate layers, leaving just the base map tiles and the contours. From this it should be possible to see if the results look plausible.
With so many options in QGIS, the best way to format all this is a much bigger exercise that we will leave to the reader. For now, as an example, these are the places within a 2.5km walk of the centre of Alnwick.


If you are using the Ordnance Survey Open Roads data, and live near the edge of one set of data then you may want to merge two shapefiles. Open the processing toolbox and use “Merge Vector Layers”. You will probably want to save the result somewhere. From the top menu: “Layer -> Save as”